Key Takeaways
- The Proctor test determines the maximum dry density (MDD) and optimum moisture content (OMC) of a soil, which are the reference values for all field compaction specifications.
- Choosing the correct test Standard (ASTM D698) for lighter loads or Modified (ASTM D1557) for heavier loads is critical. Using the wrong one invalidates all field measurements.
- The compaction curve's peak defines the MDD and OMC. The shape of the curve and its relation to the Zero Air Voids (ZAV) line provide quality checks on the test data.
- Field acceptance is typically based on achieving a percentage (e.g., 95%) of the lab-derived MDD. This requires accurate field density testing and may require corrections for oversized rock.
- Common errors like reusing soil samples, inconsistent rammer drop height, or using uncalibrated equipment can significantly compromise test accuracy and lead to costly rework.
A field crew places and compacts a lift of structural fill, confident they've hit the specified 95% compaction. But the nuclear density gauge reads 89%. The project engineer orders rework two days of lost production and the cost of re-mobilizing equipment. The problem wasn't the crew's technique. The root cause was a Proctor test back in the lab that used the standard method when the specification called for modified. The reference density was wrong from the start.
This scenario is more common than many project managers realize. The Proctor test is the definitive reference point for every compaction decision on a job site. When the test itself is wrong due to incorrect method selection, poor procedure, or flawed interpretation every downstream field measurement inherits that error.
This guide provides the practical, operational details you need to get it right. We will cover what the Proctor test actually measures, how to choose between the standard and modified versions, how to perform and interpret the test correctly, and the common errors that can compromise your results and your project's integrity.
What Is a Proctor Test and Why It Matters for Compaction Control
The Proctor test is a laboratory method that determines the relationship between the moisture content and the dry density of a soil when compacted under a specified effort. The test identifies two critical values: the optimum moisture content (OMC), which is the water content at which the soil can achieve its greatest density, and the maximum dry density (MDD), which is the highest possible dry unit weight for that compactive effort.
Operationally, this matters because every compaction specification on an earthwork project whether it says 95% or 98% is a percentage of the MDD established by a Proctor test. Earthwork specifications written around a percent of maximum dry density assume the reference MDD itself is accurate. A Proctor test performed with uncalibrated or out-of-tolerance equipment can silently shift the acceptance threshold, creating liability that no amount of field testing can correct after the fact.
The test works by compacting soil specimens at several increasing water contents. As water is added to dry soil, it acts as a lubricant, allowing particles to slide past each other into a denser arrangement. This increases the dry unit weight. Past the optimum point, however, the water begins to fill the voids that air once occupied, pushing the solid particles apart and reducing the dry unit weight. The peak of this moisture-density relationship is the OMC/MDD pair.
Governed by standards like ASTM D698 (Standard Proctor) and ASTM D1557 (Modified Proctor), along with their AASHTO T 99 and T 180 counterparts, the test applies a controlled amount of energy 12,400 ft-lbf/ft³ for standard effort and a much higher 56,000 ft-lbf/ft³ for modified. This 4.5x difference in compactive effort is not arbitrary; it simulates different field conditions and loading demands, making the choice between them a critical first step.
Standard Proctor vs Modified Proctor: Specifications and When to Use Each
The most consequential decision in Proctor testing happens before a single sample is weighed: choosing between the standard and modified test. While they share the same principle, the dramatically different compactive efforts mean they produce different MDD and OMC values for the same soil. Using the wrong one makes the resulting lab max an invalid target for field crews.
Consider a common DOT specification scenario: a state highway project requires 95% of AASHTO T 180 (modified) for the subgrade. If a lab mistakenly runs AASHTO T 99 (standard), it will report a lower MDD. This makes field results appear to pass easily, when in reality the soil is under-compacted relative to the actual specification, creating a long-term performance liability.
Standard Proctor Test (ASTM D698 / AASHTO T 99)
The standard Proctor test uses a 5.5 lbf (2.49 kg) rammer dropped from a height of 12 inches (305 mm). The soil is compacted in three layers. This procedure delivers a total compactive effort of approximately 12,400 ft-lbf/ft³ (600 kN-m/m³).
This lower effort level was designed to simulate the lighter compaction equipment common in the 1930s when the test was developed. It remains appropriate for applications where the fill will not carry heavy structural or high-volume traffic loads.
Typical applications include:
- Residential site grading and building pads
- Landscape fills and retaining wall backfill
- Utility trench backfill
- Embankments for low-volume roads
Within the standard, Method A, B, or C is chosen based on the soil's gradation. Method A uses a 4-inch mold for soil passing the No. 4 sieve (25 blows/layer). Method B uses the same mold for soil passing the 3/8-inch sieve (25 blows/layer). Method C uses a larger 6-inch mold for soil passing the 3/4-inch sieve (56 blows/layer).
Modified Proctor Test (ASTM D1557 / AASHTO T 180)
The modified Proctor test employs a heavier 10 lbf (4.54 kg) rammer and a greater drop height of 18 inches (457 mm). The soil is compacted in five layers, delivering a total compactive effort of approximately 56,000 ft-lbf/ft³ (2,700 kN-m/m³) about 4.5 times the energy of the standard test.
This higher effort was developed after World War II to replicate the effects of heavier, more effective compaction equipment and to meet the demands of heavier aircraft and truck traffic. The modified test almost always produces a higher maximum dry density and a lower optimum moisture content compared to the standard test on the same soil. This creates a more demanding compaction target for field crews.
Typical applications include:
- Highway subgrades and bases
- Airfield pavements and taxiways
- Structural fills under building foundations and industrial slabs
- Dam embankments and other critical water-retaining structures
The decision rule is simple: the project specification controls which test to use. If the plans call for 95% of modified Proctor, you must run ASTM D1557. If the specification is ambiguous, the intended loading should guide the choice, with the modified test being the default for most modern infrastructure projects.
| Parameter | Standard Proctor (D698 / T 99) | Modified Proctor (D1557 / T 180) |
|---|---|---|
| Rammer Weight | 5.5 lbf (2.49 kg) | 10 lbf (4.54 kg) |
| Drop Height | 12 in (305 mm) | 18 in (457 mm) |
| Number of Layers | 3 | 5 |
| Blows per Layer | 25 (Methods A, B) / 56 (Method C) | 25 (Methods A, B) / 56 (Method C) |
| Mold Diameter | 4 in or 6 in | 4 in or 6 in |
| Total Compactive Effort | 12,400 ft-lbf/ft³ (600 kN-m/m³) | 56,000 ft-lbf/ft³ (2,700 kN-m/m³) |
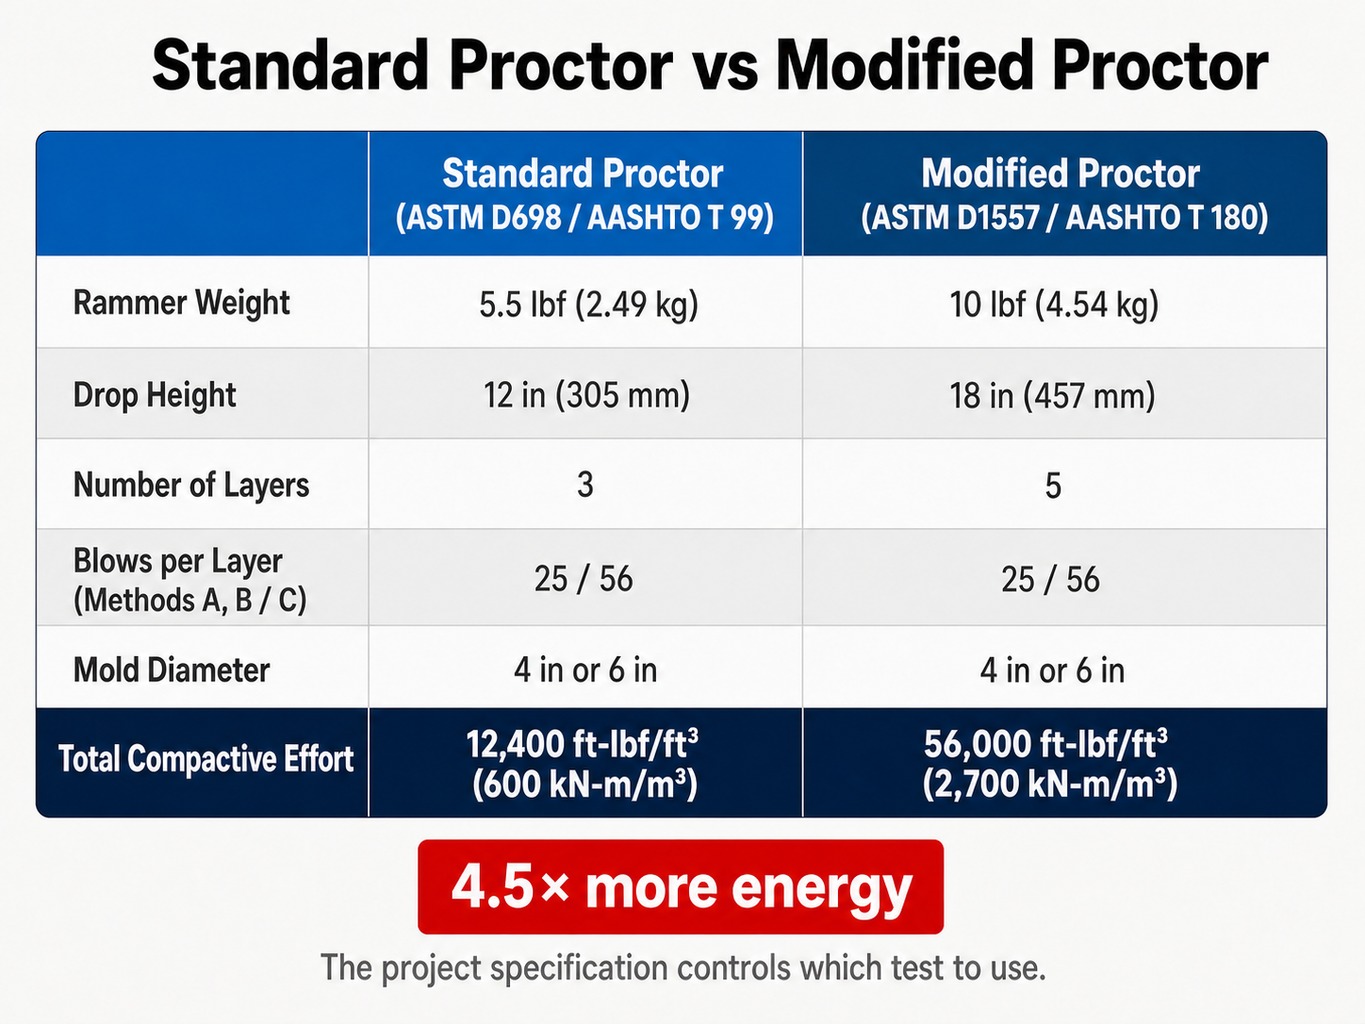
Modified proctor testing applies 4.5× more compactive energy than the standard method.
How to Perform the Proctor Compaction Test: Step-by-Step Procedure
While this guide outlines the general workflow, practitioners must always reference the current edition of the applicable ASTM or AASHTO standard for specific procedural details, tolerances, and reporting requirements. The integrity of the result depends on strict adherence to these details.
- Prepare the Soil Sample: The bulk soil sample is typically air-dried until it becomes friable. Clods are broken down, and the material is sieved over the appropriate screen (e.g., No. 4 for Method A, 3/4-inch for Method C). The percentage of oversized particles is recorded for a potential oversize correction later, per ASTM D4718.
- Establish Moisture Points: A starting moisture content is selected, usually 4-6 percentage points below the estimated OMC. The test requires at least five points to define the compaction curve properly, with at least two points on the wet side and two on the dry side of optimum.
- Mix and Temper: The required amount of water is added to the dry soil and mixed thoroughly until uniform. For some soils, particularly clays, the standard requires the moistened sample to "temper" in a sealed container for a period to allow for uniform moisture distribution.
- Compact the Specimen: The known mass and volume of the compaction mold are recorded. The moist soil is placed in the mold and compacted in the specified number of layers (three for standard, five for modified), with each layer receiving the specified number of blows from the rammer, dropped from the correct height. The surface of each layer should be scarified before adding the next.
- Determine Wet Density: After the final layer is compacted, the collar is removed, and the excess soil is carefully trimmed flush with the top of the mold using a straightedge. The mold and the compacted soil are weighed to determine the wet mass of the soil. The wet density is this mass divided by the mold's volume.
- Determine Moisture Content: The specimen is extruded from the mold. A representative moisture content sample is taken from the center of the specimen, weighed, oven-dried to a constant mass per ASTM D2216, and weighed again. This determines the exact moisture content for that compaction point.
- Repeat for All Points: Steps 3 through 6 are repeated for each of the subsequent moisture contents, using a fresh portion of the prepared soil for each point. Reusing compacted soil is explicitly prohibited by the standards because the repeated impacts break down soil particles, alter the gradation, and can artificially inflate the reported MDD.
- Calculate and Plot: For each point, the dry density is calculated by dividing the wet density by (1 + moisture content/100). The results are plotted with dry density (or dry unit weight) on the y-axis and moisture content on the x-axis to create the compaction curve.
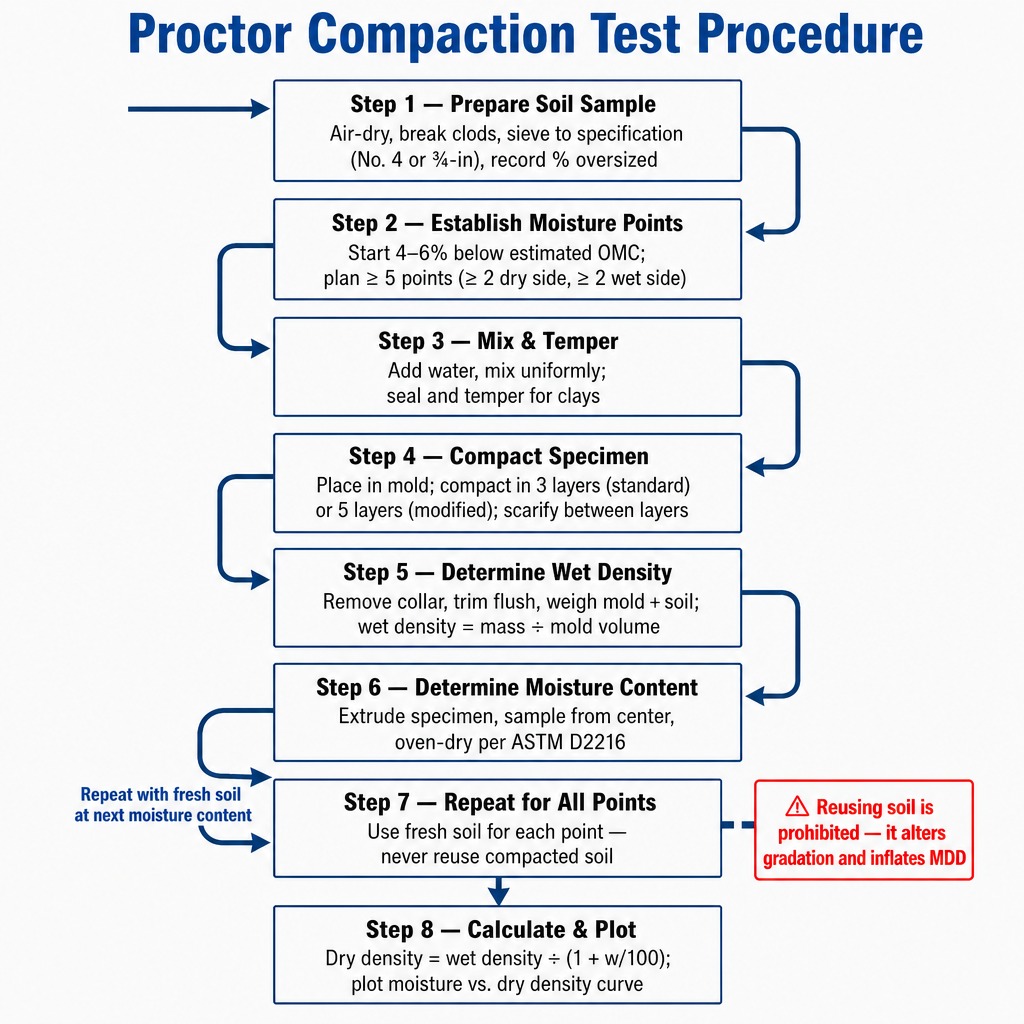
Following each step precisely is what separates a defensible Proctor test from a liability.
Reading the Compaction Curve: Optimum Moisture Content, Maximum Dry Density, and the ZAV Line
The compaction curve is the primary deliverable of the Proctor test. Reading it correctly transforms a set of data points into a usable engineering decision. The peak of the curve defines the two most important values: the optimum moisture content (OMC) on the x-axis and the maximum dry density (MDD) on the y-axis. These are the reference values against which all field compaction efforts are measured.
The shape of the curve itself is diagnostic. Fine-grained, cohesive soils like clays tend to produce sharply peaked curves, where a small deviation from OMC results in a significant loss of density. In contrast, well-graded granular soils often produce flatter, broader curves, indicating a wider range of acceptable moisture contents in the field.
Compaction on the Dry Side vs the Wet Side of Optimum
The location on the curve where a soil is compacted has direct engineering consequences.
- Dry Side of Optimum: Soil compacted at moisture contents below the OMC tends to have higher strength, greater stiffness, and higher permeability. However, it can be brittle and susceptible to collapse or settlement if it later becomes saturated.
- Wet Side of Optimum: Soil compacted at moisture contents above the OMC is more plastic, less permeable, and less prone to collapse. However, it has lower strength and is more compressible.
This isn't just a lab curiosity. A dam core, for example, is often specified to be compacted "wet of optimum" to ensure low permeability and prevent internal erosion. Conversely, a highway subgrade is typically compacted near or slightly dry of optimum to maximize its strength and bearing capacity.
What the Zero Air Voids Curve Tells You
The zero air voids (ZAV) curve, also known as the 100% saturation line, is a theoretical boundary plotted on the same graph as the compaction curve. It represents the maximum possible density the soil could achieve at a given moisture content if all the air voids were expelled, leaving only soil solids and water.
This line is calculated based on the soil's specific gravity. Its purpose is to serve as a quality check. Since it is physically impossible to remove all air with impact compaction, the empirical compaction curve must lie entirely below and to the left of the ZAV curve. If any measured data point falls on or to the right of the ZAV line, it signals an error in the test most commonly an incorrect specific gravity value was used for the calculation, or there was an error in the measured density or moisture content. The ZAV line is a simple, powerful tool for catching errors before a flawed result leaves the lab.
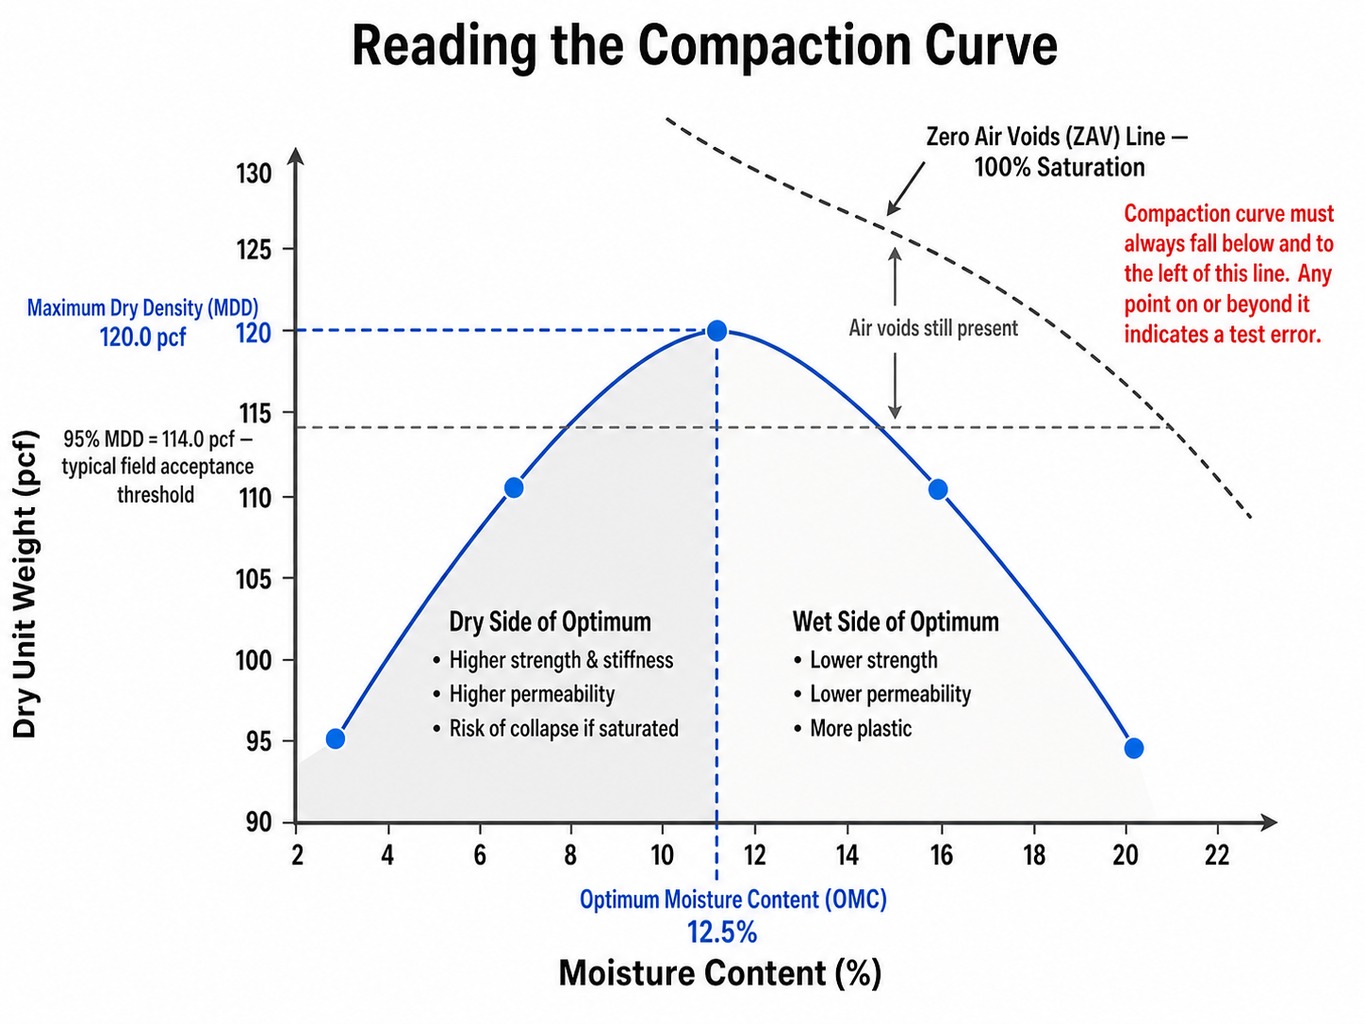
The compaction curve's peak defines the MDD and OMC that control every field proctor test decision.
From Lab to Field: How Proctor Results Drive Compaction Acceptance
Once the lab has a reliable Proctor result, how does it translate to a pass/fail decision on a construction site? The process connects the lab MDD to field measurements through the concept of relative compaction.
Most earthwork specifications require a minimum relative compaction, typically 90%, 95%, or 98% of the laboratory MDD. For example, a 95% MDD requirement means that if the Proctor test determined an MDD of 120.0 pcf, the in-place density of the compacted fill must be at least 0.95 x 120.0 = 114.0 pcf.
Field density is measured using one of several methods:
- Nuclear Density Gauge: A device like a Troxler or Humboldt gauge measures in-place density and moisture by emitting and detecting radiation. This is the most common method for production testing due to its speed.
- Sand Cone Test (ASTM D1556): A small hole is excavated, the soil is weighed, and the volume of the hole is measured by filling it with a calibrated sand of known density.
- Rubber Balloon Method: Similar to the sand cone, but the hole volume is measured with a water-filled balloon.
A critical point of disconnect between lab and field is the presence of oversized particles. If the field soil contains a significant fraction of rock larger than what was used in the lab test (e.g., >3/4-inch), the lab MDD must be mathematically corrected using the procedure in ASTM D4718. This correction accounts for the higher density of the rock fraction. Failing to apply this correction is a common source of false failures in the field, where a well-compacted lift fails the test simply because it's being compared to an uncorrected, artificially low lab max.
For high-volume earthwork with a consistent soil source, some agencies use a one-point Proctor method for quality control. After establishing a "family of curves" for the borrow source, a single compaction point can be used to verify that the material is behaving as expected, providing a quick check on the MDD without the time and expense of a full five-point test.
Common Errors That Compromise Proctor Test Accuracy
The Proctor test is straightforward in concept but highly sensitive to procedural discipline. Seemingly small deviations can compound into significant errors in the reported MDD and OMC, leading to invalid field targets.
- Reusing Compacted Soil: This is a tempting shortcut that saves time but degrades particles, especially in weaker soils. The progressive breakdown of aggregates alters the soil gradation, which almost always results in an artificially high MDD that is not achievable in the field.
- Inconsistent Rammer Drop Height: The compactive effort is a direct function of the rammer's mass and drop height. A technician letting the hammer fall from 11 inches instead of 12 on a manual rammer consistently under-applies energy. This is a major source of variability.
- Insufficient Tempering Time: If water is not allowed to distribute uniformly throughout a soil specimen, particularly in clays, the moisture content will be inconsistent. This leads to erratic points that make it difficult to plot a reliable compaction curve.
- Using Too Few Data Points: A curve plotted from only three points can easily miss the true peak, especially for soils with flat curves. The standard requirement for at least five points, with two on either side of optimum, is designed to prevent this.
- Incorrect Mold Volume: Routine internal audits can uncover issues as seemingly minor as a Proctor mold that has worn to an internal volume just beyond its tolerance limit. This produces a systematic error in every density calculation, biasing every result high or low.
- Biased Moisture Samples: Taking the moisture content sample from the dried-out surface of an extruded specimen instead of its center, or using a sample that is too small to be representative, directly biases the OMC and the calculated MDD.
Many of these failure points are rooted in equipment that has drifted out of tolerance. Rammer weight, drop height, and mold dimensions are all measurable quantities that require periodic verification.
Read more: Equipment Maintenance and Service | Calibration Experts | Cal-Cert
Why Equipment Calibration Is the Foundation of Every Reliable Proctor Result
You can follow every procedural step in the ASTM standard with perfect discipline and still produce an unreliable result if your equipment is out of tolerance. The Proctor test is only as good as the apparatus used to perform it. This is where the chain of measurement integrity begins.
At Cal-Cert, we provide ISO/IEC 17025 accredited calibration for the full suite of compaction testing equipment. Using NIST-traceable standards, we verify that your rammers have the correct mass and drop height, your molds have the correct internal volume, and your balances and ovens are performing accurately. When an auditor or project owner questions a Proctor result, the first document they ask for is the calibration record for the equipment. Our audit-ready documentation closes that traceability gap before the question is even asked.
For busy labs, our on-site calibration service minimizes asset downtime, allowing you to maintain testing throughput while ensuring your foundational measurements are defensible. If the Proctor test is the baseline for your project's quality, then traceable equipment calibration is not optional maintenance it is a fundamental requirement for measurement integrity.
Read more: Construction Materials Calibration | Cal-Cert
Request a calibration quote for your compaction testing equipment
Conclusion
The Proctor test is far more than a routine lab procedure. It is the measurement foundation upon which every field compaction decision rests. Its reliability hinges on a triad of discipline:
- Correct Test Selection: Choosing between the standard and modified test based on project specifications and loading conditions.
- Disciplined Procedure: Adhering strictly to the ASTM or AASHTO standard, from sample preparation to the number of blows per layer.
- Calibrated Equipment: Ensuring that the rammers, molds, and balances used in the test are verified and traceable.
From test selection through curve interpretation and field application, each step either strengthens or undermines the chain of measurement confidence. As the industry moves toward performance-based specifications and intelligent compaction, the Proctor test remains the essential baseline. And a baseline is only useful if it is accurate, repeatable, and defensible.
Frequently Asked Questions
What soil types are not suitable for the standard Proctor test?
Soils with more than 30% of particles retained on the 3/4-inch sieve exceed the gradation limits for ASTM D698/D1557. Additionally, free-draining soils like clean gravels may not show a well-defined moisture-density peak, making relative density testing (ASTM D4253/D4254) more appropriate.
How often should Proctor tests be repeated during earthwork construction?
A new Proctor test is typically required whenever the soil source changes or when visual inspection or index property tests (like Atterberg limits) indicate the material has changed. On large projects, agencies often mandate a new test for every 5,000 to 10,000 cubic yards of fill placed.
Is a proctor test the same as a proctored exam?
No. A Proctor test (named after engineer R.R. Proctor) is a soil compaction test used in geotechnical engineering. A proctored exam is a supervised academic or professional test. The similar-sounding words refer to completely unrelated concepts.
Why does the modified Proctor test produce a higher maximum dry density than the standard test?
The modified test applies about 4.5 times more compactive energy (56,000 vs 12,400 ft-lbf/ft³) via a heavier rammer and greater drop height. This extra energy forces soil particles into a denser arrangement and expels more air, resulting in a higher MDD at a lower OMC.
Can you use a nuclear density gauge to replace the Proctor test?
No. A nuclear density gauge measures the in-place density of compacted soil in the field. It does not determine the soil's maximum potential density. The gauge result is compared against the lab's Proctor test result to calculate relative compaction, so the two tests serve different, complementary functions.
What happens if the compaction curve has two peaks?
A double-peaked curve can indicate a gap-graded soil, inconsistent sample preparation, or a mixture of two distinct soil types. If the soil is genuinely bimodal, the specification may require separate testing of each fraction or using a test fill to establish field compaction criteria.